写作题目:
2014年4月12日雅思小作文写作真题TASK1
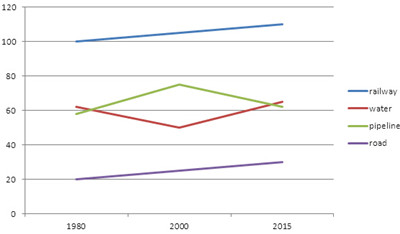
The line graph below shows the quantities of goods transported by water, railway, water and pipeline in a particular European country from 1980 to 2015.The graph also predicts the quantities in 2015. Summarize the information by selecting and reporting the main features, and make comparisons where relevant.


